India’s electricity demand is surging, driven by rapid economic growth, population expansion, urbanisation, and nationwide electrification efforts. To meet the growing demand and reach its target of installing 500 GW of non-fossil-fuel capacity by 2030, the country is expanding its renewable energy base at an unprecedented rate. In FY2025 alone, India added 23.8 GW of new solar capacity and 4.15 GW of wind, bringing the total non-fossil capacity to 228 GW (see Table 1A).
Unlike conventional power sources that provide predictable, dispatchable output, renewables depend on unpredictable weather patterns that do not align with electricity demand curves, hindering the efficiency and financial stability of existing power markets. Solar power peaks midday when demand is moderate, while wind generation varies seasonally and unpredictably. India’s power sector must now evolve — not just in terms of capacity, but also flexibility, efficiency, and financial sustainability.
Why traditional power markets fall short
Traditional long-term power purchase agreements (PPAs) were drafted when the energy supply was more predictable. With renewables, however, the rigid structure of PPAs often results in penalties and inefficiencies for power producers when actual generation deviates from forecasts.
Short-term electricity markets in India
Table 1: Overview of India’s short-term electricity market segments (FY2024)
Source: CERC, 2024 Note: Volumes in KWh billion units. |
|---|
These markets use a uniform pricing mechanism. Buyers (such as distribution companies, open-access consumers, and traders) submit purchase bids that list the quantity they require plus the maximum price they are willing to pay. Sellers (such as generating companies, traders, and licensees) submit sale bids that mention the quantity they can offer, along with the minimum price they are willing to accept. The exchange aggregates bids into demand and supply curves. Where the two curves intersect determines the uniform market clearing price (MCP) and market clearing volume (MCV) for each 15-minute block. All successful bids are transacted at the uniform MCP, ensuring transparent and fair pricing across market segments, including the DAM, RTM, TAM, and GDAM.
Recent trends observed in short-term power markets
While the Day-ahead Market (DAM) remains dominant, other markets are expanding quickly:
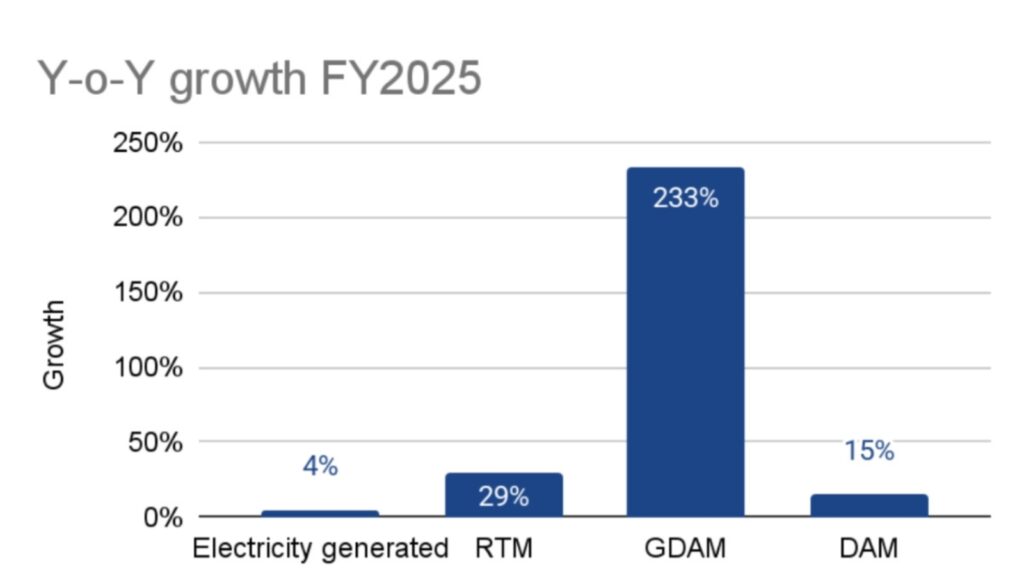
- GDAM’s volume rose 233% year-over-year in FY2025.
- RTM grew by 29% in the same period, reflecting rising demand for more flexible power delivery arrangements.
This rapid growth in the green and real-time segments is remarkable, considering total electricity generation rose only 4% (1,814 v/s 1,739 billion KWh) in the same period. The data shows rising interest in RE-linked and time-sensitive trading.
Figure 1: Segment-wise volume traded on IEX (2021–2025)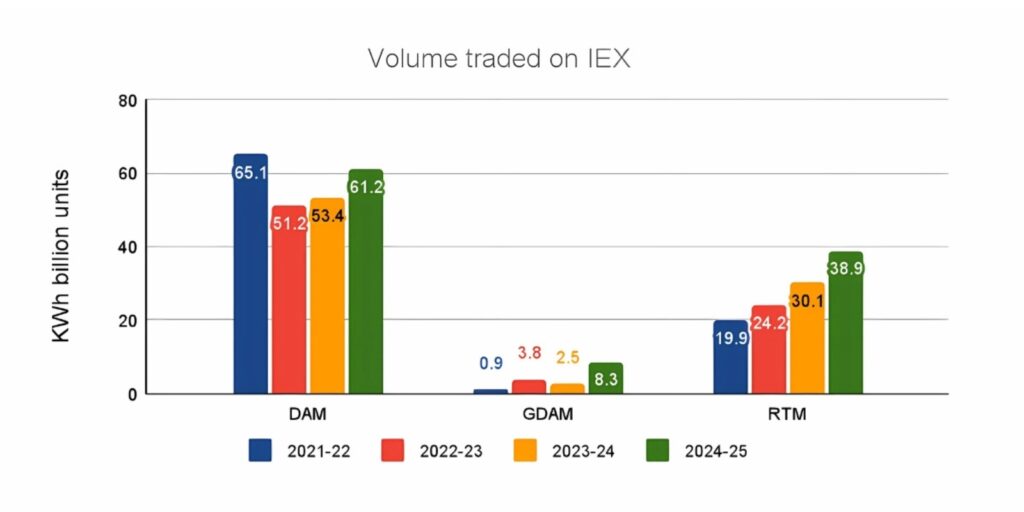
Figure 2: Y-o-Y growth: Power markets & generation (FY2025)
Source: IEX, (n.d.a.); CEA, 2024; IEEFA, (n.d.); see Table 2A
However, rising supply without matching demand can give rise to risks. Between May 25 and June 1, 2025, the RTM on the IEX faced extreme imbalances:
- Purchase bids fell by 5% compared to the same period in 2024, while sale bids almost doubled. This mismatch, combined with low weekend demand, resulted in near-zero prices
- Sale bids reached 3.56 million MWh, while purchase bids stood at only 1.44 million MWh (just 41% of sale bids).
- Average MCP fell to ₹2,531/MWh, compared to ₹4,618/MWh during the same week in 2024, when purchase bids were a much healthier 85% of sale bids.
- On 25th May and 1st June, prices dropped to nearly ₹0/MWh between 10 a.m. to 2 p.m., driven by a significant supply–demand mismatch.
Figure 3: RTM volume & price trends (25 May – 1 June 2025)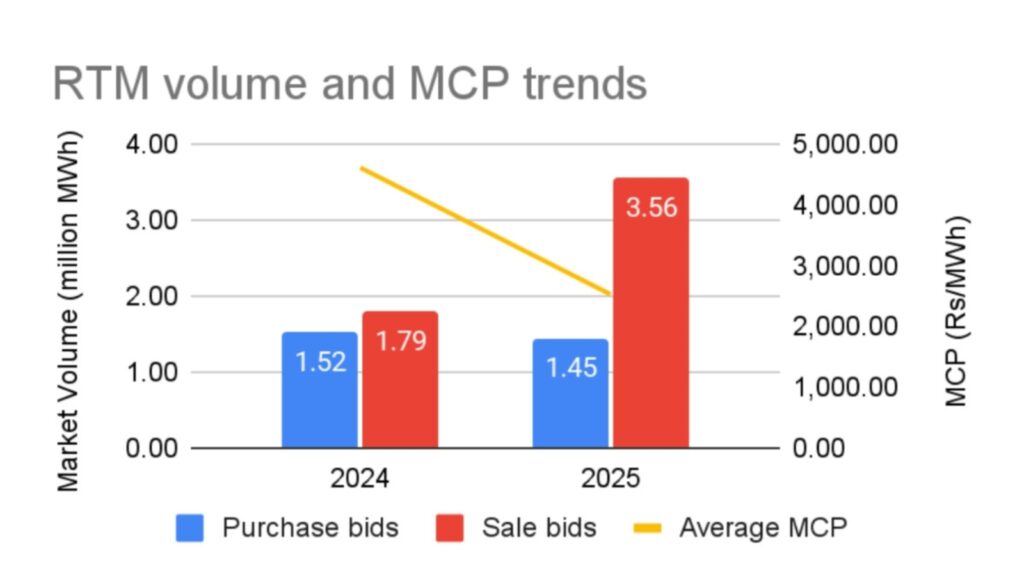
Source: IEX n.d.b.; see Table 3A
Even in the Daily-ahead Market (DAM), during the last few days in May (as observed in Figure 3 below), sale bids far outpaced purchase bids, causing the daily MCP to fall to nearly ₹2,000/MWh.
Figure 4: DAM volume & price trends (May 2025) 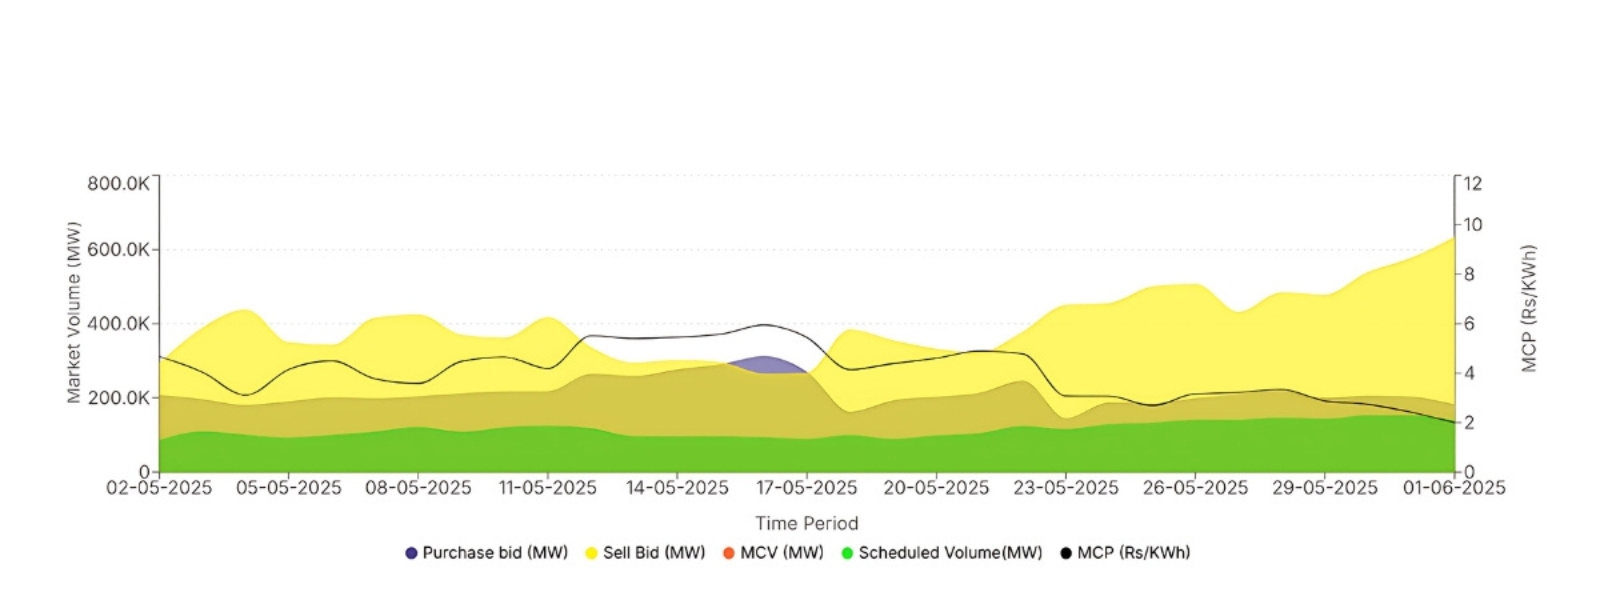 Source: IEX, n.d.c.
Daily market behaviours reflect these imbalances:
- Even on a typical day, from 8 a.m. to 4 p.m., when there are more solar sale bids but limited demand compared to supply, the curve shifts to the right, and the intersection occurs at a very low price.
- After 6 pm, as the solar supply decreases, the curve shifts to the left, and with potentially higher demand, the clearing price rises.
These patterns serve as a warning. Even in a high-growth renewable market, financial viability depends not just on supply but on the ability to match it with responsive and flexible demand.
The Green Real-time Market
To address these issues, the Indian Energy Exchange (IEX) has proposed a Green Real-time Market (G-RTM). It is designed to make renewable energy trading more responsive and better valued:
- RE-only participation: A new segment of the RTM exclusively for trading RE.
- Bundled green attributes: Power and its green value (like RECs) are bundled and traded together. Power bought here counts toward renewable purchase obligations (RPOs).
- Real-time responsiveness: Operates like the RTM with hour-ahead scheduling, making it ideal for managing weather-driven variability compared to GDAM and GTAM.
- Similar model: Follows the same bidding, matching, and price discovery processes as the current RTM.
While G-RTM offers significant advantages, its implementation raises essential considerations.
The market will primarily increase RE supply, particularly during solar-heavy hours (8 a.m.–4 p.m.), which risks worsening the existing oversupply problem. If buyers demand fragments between RTM and G-RTM, the overall demand per market could fall, leading to even lower prices.
How new tenders could shape G-RTM
With new, complex tenders featuring more dispatchable renewables, such as those under the new firm and dispatchable renewable energy (FDRE) framework, the role of short-term markets may prove critical.
Experts anticipate that:
- These bids, which involve oversizing wind and solar capacity with storage to meet load curve requirements, are expected to generate surplus electricity that can be sold on the exchange.
- A large part of the returns for these projects is expected to accrue from sales to short-term markets.
- With further deep penetration of renewable energy in line with 2030 targets and beyond, a larger volume of the RE electricity may be traded in the short term, including on the G-RTM.
Annexure
Table 1A: India’s installed electricity capacity growth in FY2025
| Energy source | Type | As on 31 March 2024 (GW) | As on 31 Mar 2025 (GW) | Change (GW) | % of new capacity added |
| Wind power | Renewables | 46 | 50 | 4.15 | 12% |
| Solar power | 82 | 106 | 23.83 | 72% | |
| Small hydro | 5 | 5 | 0.10 | 0% | |
| Biomass | 10 | 11 | 0.39 | 1% | |
| Waste to energy | 0.586 | 0.84 | 0.25 | 1% | |
| Large hydro | 47 | 48 | 0.80 | 2% | |
| Nuclear | Nuclear | 8 | 8 | 0.00 | 0% |
| Coal (+ lignite) | Fossil Fuels | 218 | 222 | 4.22 | 13% |
| Gas | 25 | 25 | −0.50 | −2% | |
| Diesel | 0.589 | 0.589 | 0.00 | 0% | |
| Total | 442 | 475 | 33.24 | 100% |
Source: PIB (2025); IEEFA (n.d.)
Table 2A: Annual trading volumes & growth (2021–2025)
| Particulars | 2021–22 | 2022–23 | 2023–24 | 2024–25 | Growth (%) |
| DAM | 65.1 | 51.2 | 53.4 | 61.2 | 15% |
| GDAM | 0.9 | 3.8 | 2.5 | 8.3 | 233% |
| RTM | 19.9 | 24.2 | 30.1 | 38.9 | 29% |
| Electricity Generated | 1491.9 | 1624.5 | 1739.1 | 1814.5 | 4% |
Source: IEX, n.d.a.; CEA (2024); IEEFA (n.d.)
Note: Volumes in KWh billion units. The market volumes are only based on the IEX market.
Table 3A: RTM volume traded on IEX & key metrics (25 May–1 June 2025)
| Year | Purchase bids (MWh) | Sale bids (MWh) | Final scheduled volume (MWh) | Average market clearing price (MCP) | Purchase/sale |
| 2024 | 1,520,369 | 1,792,898 | 980,250 | 4,618.16 | 85% |
| 2025 | 1,445,151 | 3,560,428 | 1,277,841 | 2,531.28 | 41% |
Source: IEX (n.d.b.)
By Shubhansh Garg, Analyst at Climate & Sustainability Initiative (CSI). Views expressed are personal.
References:
CEA. (2024). Growth of electricity sector in India from 1947–2024. Central Electricity Authority. https://cea.nic.in/wp-content/uploads/pdm/2024/08/Growth_Book_2024.pdf.
CERC. (2024). Report on short-term power market in India 2023–2024. Central Electricity Regulatory Commission. https://cercind.gov.in/2024/market_monitoring/Annual%20Report%202023-24.pdf.
IBEF. (2025). Power. India Brand Equity Foundation. https://www.ibef.org/download/1744008776_Power-February-2025.pdf.
IEEFA. (n.d.). POWERup: Update on India’s electricity capacity, generation, and investment. Institute for Energy Economics and Financial Analysis. https://ieefa.org/powerup-update-indias-electricity-capacity-generation-and-investment.
IEX. (n.d.a.). Indian Energy Exchange. https://www.iexindia.com/.
IEX. (n.d.b.). Real time market snapshot. Indian Energy Exchange.
IEX. (n.d.c.). Day ahead market snapshot. Indian Energy Exchange.
https://www.iexindia.com/market-data/day-ahead-market/market-snapshot?interval=DAILY&dp=SELECT_RANGE&showGraph=false&toDate=01-06-2025&fromDate=02-05-2025.
IEX. (2024). Petition No. 277/MP/2024 (12 July 2024). Indian Energy Exchange. https://www.iexindia.com/apiview/preview-pdf?url=https://doc.iexindia.com/files/IEX-Petition-12-07-2024-il2Z74zO738l.pdf.
PIB. (2025). Energizing the future: POWERup Q1 2025 highlights. Press Information Bureau, Government of India. https://www.pib.gov.in/FactsheetDetails.aspx?Id=149218.